After creating this WordPress site and finally getting it hooked up to the NGINX reverse proxy, I was left with a horrible website load time (something on the order of 10-12 s). In this post, I will show you a beginning guide to troubleshooting slow website response times.
1. Benchmark Your Site
The first thing you should do is quantify your site's slowness. If you don't know how fast (or slow) your site was to begin with, how can you know when you've fixed it? One of the best tools for this is to use your browser's developer tools, but you can also use a service such the Pingdom Website Speed Test or WebPageTest.
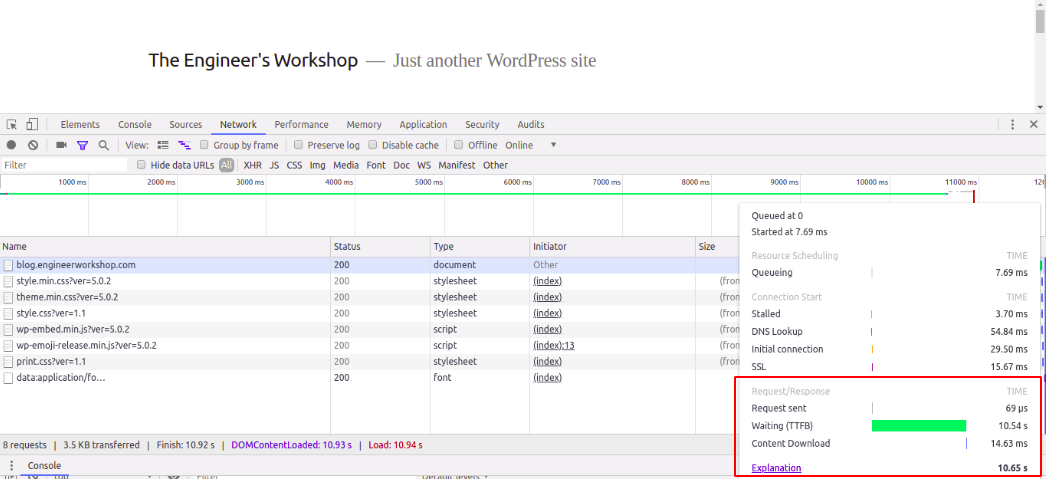
The above screenshot is from using developer tools in Chrome (Ctrl+Shift+I) and recording the initial page request. I wouldn’t wait such a time for a web page to load and it’s my own web page!
2. Identify Potential Bottlenecks (Divide and Conquer)
Now on to identifying the source of the slow response time. I find diagrams always help me think more clearly:
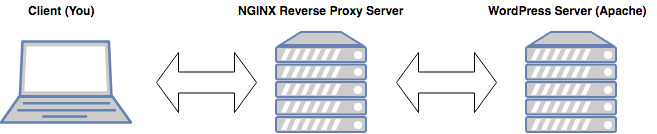
The diagram above gives a high level overview of how this website is served to you. You send a request to my NGINX reverse proxy, which then requests a web page from Apache (my WordPress server). The Apache server responds with the requested web page to the NGINX reverse proxy server and the reverse proxy server returns your web site request to your browser. Normally, this all happens very quickly, and in fact it does on my other servers, but something was obviously wrong here with my new build.
The real value of drawing a diagram is that it helps you identify all of the moving parts of your system which in turn helps you theorize about how that system could break. In the diagram above, you can see that the problem could be in the:
- Client
- Interaction Between the Client and Reverse Proxy:
- Download speed (or even ping) of the client
- Upload speed of the reverse proxy
- On the NGINX Reverse Proxy Server Itself
- Interaction Between the Reverse Proxy and Backend (Upstream) Apache WordPress Server
- On the Apache/WordPress Server
3. Check Your Logs
Logs can be an excellent resource for identifying your bottleneck. To figure out which piece in my above diagram was the culprit, I decided to check the log files on both my NGINX reverse proxy and my backend Apache server running WordPress. I had a TTFB of over 10 seconds- that time had to be going somewhere! As Sherlock Holmes says, “Data, data, data! I cannot make bricks without clay."
Now, here’s a subtlety you should be familiar with: NGINX access logs are written at the end of a request [source], while Apache logs are written at the beginning of the request [source].
In my case, the NGINX access log showed a request fulfilled time a full 10+ seconds after the Apache log is showing its request received time! This means the slow response time was in the Apache response!
Further confirmation was obtained by including %D in the Apache access log which is a mnemonic that records the time between when the Apache server receives the HTTP request and when it returns a response to the client. Lo and behold, my Apache access logs showed a 10 s response time.
4. Iterate Until Done
So, now I had confirmed that the source of my slow response time was on my Apache server, but now what? What was causing that?
The answer is to go back to step 2 above and repeat. The difference this time is that instead of having the whole system to look at, we can focus our list of potential problems to ones specific to the WordPress server. In my case, since this was running on a Raspberry Pi, I was suspicious of the hardware itself. I ran sar, while visiting my site and sure enough, iowait spiked to 80-90% for several seconds without full RAM utilization. This is a notorious problem on the Raspberry Pi and is indicative of the slow read/write speeds from running everything off of a microSD card. This was even with other optimizations such as proxy_caching on the reverse proxy and fastcgi_caching setup.
So ultimately the problem was the hardware of my server itself. I instead installed a LEMP stack on a LIVA mini PC and then configured WordPress. I suppose I could've also tried a higher end microSD like a Samsung; maybe next time. Regardless, this brought me down to a load time of between 0.9-1.4 s and a TTFB to a much more acceptable 150-250 ms.