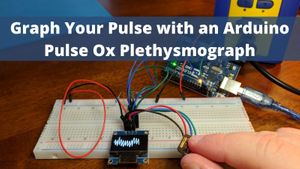
With the recent COVID-19 outbreak, I have noticed a new interested in biomedical engineering and electronics among the general population. In this tutorial, I’ll guide you through creating your own Arduino-based pulse plethysmograph.
Why I Made This Project
I make most of the gifts I give for birthdays and Christmas. Typically, this is some bespoke electronics project unique to that person’s interests.
For example, with my mom, her main interest is the weather, so in the past I’ve made a lightning strike detector, complete with OLED display, togglable strike alarm, and 3D printed box.
With an interest as broad as weather, there’s a lot of fodder for projects. The problem I run into is what to get (or in my case, make) for my wife. I suspect, like most husbands, I may not be alone in this regard. So, this past Christmas, when my wife (perhaps a little envious of the gifts I make for everyone else) asked me to make something for her, I had a bit of a panic and had to dig through my memory for ideas on what to make for her.
In my frantic search, there was one thing that stuck out in my mind: I remembered my wife’s fascination with pulse oximeters. She always thought they were so cool whenever I’d show her the pulse ox on a Lifepak at work. (Don’t get me wrong, I find pulse oximeters to be really interesting too but, then again, I was a medical student, a medic, and also my undergrad is in biomedical engineering, so of course I find them fascinating. The part that’s surprising to me is that anyone outside of the field finds them as exciting as I do.)
“Bingo!”, I thought. But you know what’s cooler than just a static number on a screen? A graph of your pulse on the screen and so I ended up making her a pulse ox plethysmograph (“pleth”) for Christmas.
With the recent COVID-19 outbreak, I have noticed a new interested in biomedical engineering and electronics among the general population, and so I hope that you too might also find this project interesting. In today’s article, I’ll guide you through creating your own Arduino-based pulse plethysmograph.
What Is a Pulse Plethysmograph?
Plethysmography in general is used to measure a change in volume. From med school, when I think of plethysmography, I tend to think of lung plethysmography, where basically a patient sits in a sealed box and as they breath in and out, the pressure change of the air in the box (being a closed system), is used as a proxy for determining the lung volume at various stages of the ventilatory cycle.
Clinically, there are other uses for plethysmography besides pulmonary testing that thankfully aren’t as cumbersome to perform. For example, in today’s project, what we’ll actually be making is what's known as a photoplethysmograph (PPG). Photoplethysmography works by passing light through the skin and measuring the change in blood volume based on the amount of light absorbed (hence the “photo” prefix of photoplethysmograph). (This is very similar to how a pulse oximeter measures oxygen saturation in the blood which is why the devices are often combined and your typical high-end pulse ox can also display a PPG.)
Let’s begin!
Bill of Materials (“Required Parts”)
In order to get started, you’ll need the following:
- Arduino (If you don’t already have a breadboard/jumper wires/resistors, I’d recommend this Arduino starter kit; if you do already have these parts, I just keep a stockpile of these.)
- OLED Display
- MAX30102 pulse oximeter module
- 2.2 kΩ resistors (x2)
- Breadboard
- Jumper wires
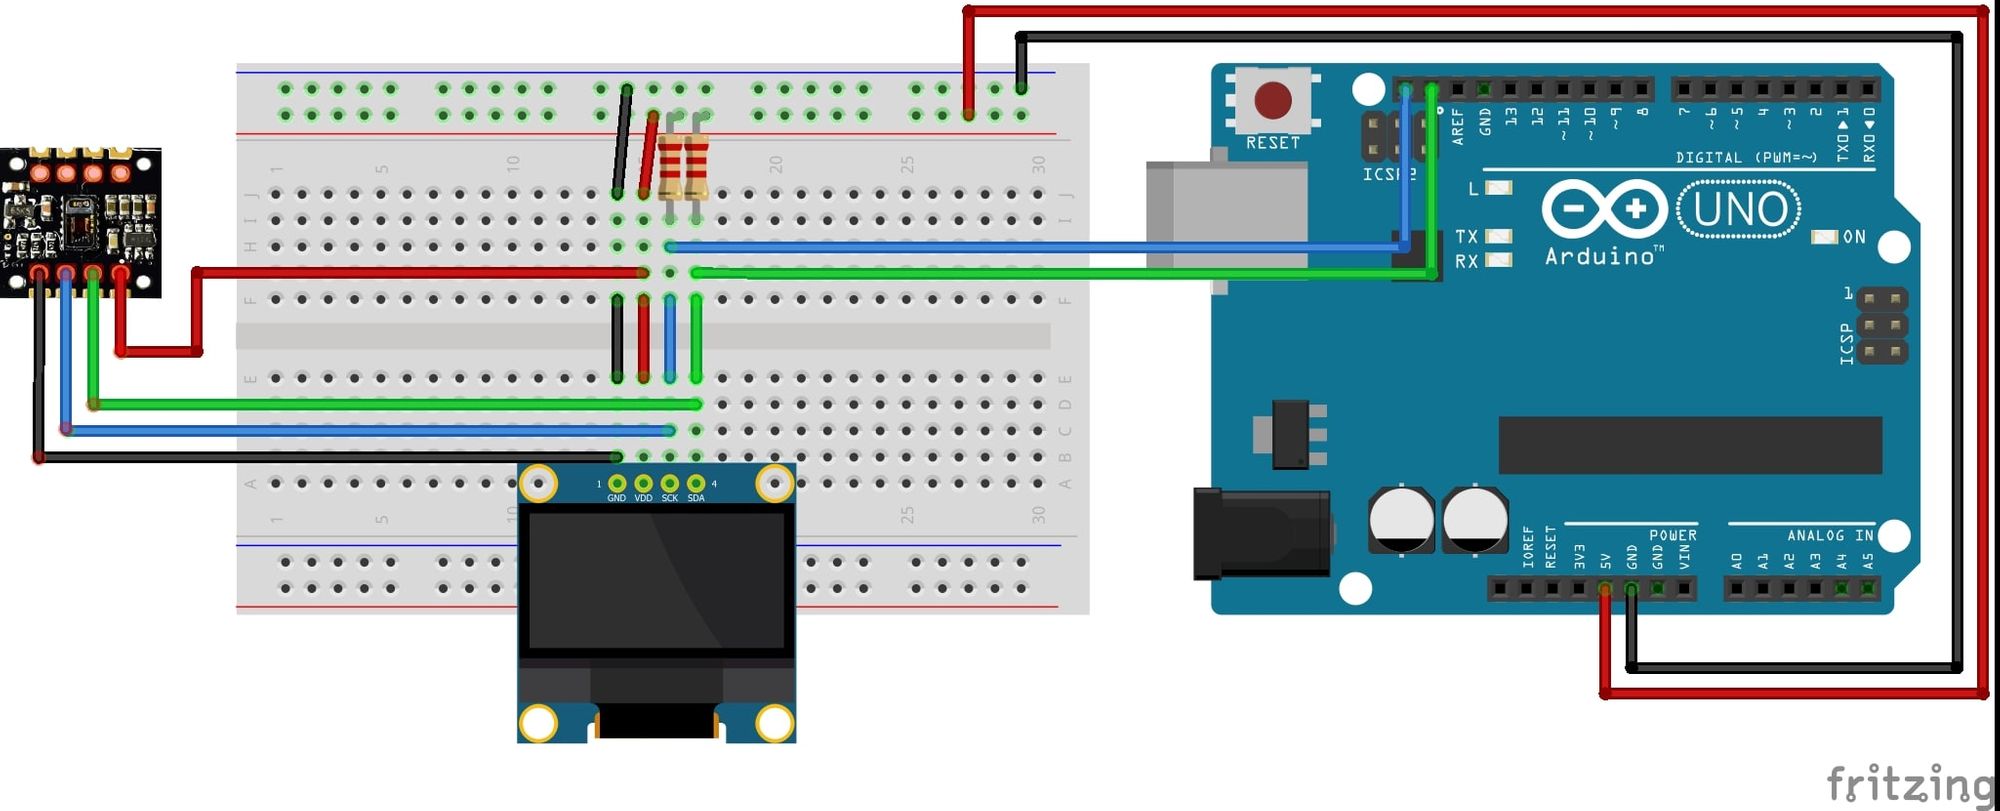
Schematic
For this project, we'll be using the I2C protocol. Wire up your board as shown in the Fritzing diagram below.
Code
Upload the following code to your Arduino board:
#include <Wire.h>
#include <Adafruit_GFX.h>
#include <Adafruit_SSD1306.h>
#include "MAX30105.h"

MAX30105 particleSensor;

Adafruit_SSD1306 oled(128, 64, &Wire, -1);
byte x;
byte y;
byte z;
byte lastx;
byte lasty;
long baseValue = 0;
long lastMin=2200000;
long lastMax=0;
long rollingMin = 2200000;
long rollingMax=0;

void setup() {
  Serial.begin(115200);
  particleSensor.begin(Wire, I2C_SPEED_FAST);
  oled.begin(SSD1306_SWITCHCAPVCC, 0x3C);

  //Setup to sense a nice looking saw tooth on the plotter
  byte ledBrightness = 0x1F; //Options: 0=Off to 255=50mA
  byte sampleAverage = 8; //Options: 1, 2, 4, 8, 16, 32
  byte ledMode = 3; //Options: 1 = Red only, 2 = Red + IR, 3 = Red + IR + Green
  int sampleRate = 100; //Options: 50, 100, 200, 400, 800, 1000, 1600, 3200
  int pulseWidth = 411; //Options: 69, 118, 215, 411
  int adcRange = 4096; //Options: 2048, 4096, 8192, 16384

  particleSensor.setup(ledBrightness, sampleAverage, ledMode, sampleRate, pulseWidth, adcRange);

  //Take an average of IR readings at power up; this allows us to center the plot on start up
  const byte avgAmount = 30;
  long reading;
  for (byte x = 0 ; x < avgAmount ; x++){
    reading = particleSensor.getIR();

    // Find max IR reading in sample
    if (reading > lastMax){
      lastMax = reading;
    }

    // Find min IR reading in sample
    if (reading < lastMin){
      lastMin = reading;
    }
  }

  x = 0;
  y = 0;
  lastx = 0;
  lasty = 0;
  delay(2000);
  oled.clearDisplay();
}

void loop() {

  // Display is only 128 pixels wide, so if we're add the end of the display, clear the display and start back over
  if(x>127)
  {
    oled.clearDisplay();
    x=0;
    lastx=x;
  }

  // Even though we're keeping track of min/max on a rolling basis, periodically reset the min/max so we don't end up with a loss of waveform amplitude
  if (z > 30) {
    z = 0;
    lastMax = rollingMax;
    lastMin = rollingMin;
    rollingMin = 2200000;
    rollingMax = 0;
  }

  oled.setTextColor(WHITE);
  long reading = particleSensor.getIR();    // Read pulse ox sensor; since this is a pulse pleth, we're really only after the IR component
  int y=40-(map(reading, lastMin, lastMax, 0, 40));   // Normalize the pleth waveform against the rolling IR min/max to keep waveform centered
  Serial.println(reading);
  oled.drawLine(lastx,lasty,x,y,WHITE);

  // Keep track of min/max IR readings to keep waveform centered
  if (reading > rollingMax){
    rollingMax = reading;
  }

  if (reading < rollingMin){
    rollingMin = reading;
  }

  // Keep track of this IR reading so we can draw a line from it on the next reading
  lasty=y;
  lastx=x;

  oled.display();
  x++;
  z++;
}
Note that you’ll also need to install Sparkfun’s MAX3010x Sensor Library plus Adafruit’s SSD1306 and GFX libraries, all of which can be found in the Arduino Library Manager.
You can find the most up-to-date code from my Torqu3Wr3nch/pulseOxPleth repository on Github.
To keep the waveform centered, I've implemented a rolling average of IR readings. Occasionally you'll see the waveform shift as the average is recalculated and the waveform normalized. This is actually something you see on the floor with real monitors and I bet they're implementing a similar algorithm.
I've commented the code to help new coders understand what's going on. As always, let me know if you build this project and/or have any questions!